Those that have been around the Veeam world for a while will most likely know what I am referring to in the title of this blog post. That said, I have seen quite a few seasoned veterans still overlooking one of the arguably most powerful reporting capabilities inside the product, the Infrastructure Overview report for Visio!
To try and be brief, this report will go out and collect metrics from all over your vSphere and/or HyperV deployments & compile that into a series of Visio diagrams. Now, one might say, that’s easy enough to do manually if you are a Visio wizard (to which perhaps Merlin himself would argue it isn’t easy), but the underlying beauty of this report is yet to be discovered by many! Think about how frequently virtual environments change… It’s almost inevitable that by the time you are 1/4 of the way through constructing your Visio, the initial information you charted is now outdated, moved, deleted, replicated, etc.. Point is, it would be near impossible to keep a master set of Visio’s up-to-date in an ever-changing virtual topology!
Before you will be able to leverage all the goodness of this report, you’ll have to check a few boxes first. 1.) You will need to download & install the Veeam Report Viewer on whichever machine you plan to run the report from. I mention this because you do not have to install this report viewer on the Veeam ONE server itself. This can be installed locally on your client machine (desktop, laptop, etc..) and ideally, on the same machine where Visio is already installed, because.. 2.) You’ll need to have Microsoft Visio installed on whichever machine you plan to run this report from.
To locate this report in Veeam ONE, simply navigate over to Veeam ONE Reporter, click on the Workspace tab, then look at the very bottom for the Offline Reports folder. Inside, you will see the Infrastructure Overview (VISIO). You will have the ability to include/exclude your virtual machines, then you hit Preview to actually start the process (watch for pop-up blockers) …See two screenshots below from the user guide.


Now, once you have satisfied the requirements, now the fun starts. The process is actually quite simple, once you hit preview (as described above), it will download the VMR file which you simply double-click and it will open using the Veeam Report Viewer. From here, grab a coffee and sit back as it compiles. You will know when it’s finished because Visio will open with a high-level view of your environment (example below).

This is the point where I see mistakes happen. The construction of this level of Visio is nice & clean; however, super basic and not incredibly valuable to most. Notice the little small smart tag (little “i” with a circle around it) in the top left-hand corner…. Click that and you’ll see something similar to this..

If you click on any of those options, another Visio should open with much more detail than before, as the below example shows when I chose VMware Storage…

If we take a closer look…

For many, this report has already started proving valuable. I would argue; however, if this is as far as you take the report, you are missing the grand finale on why this single report has sold countless licenses for Veeam ONE. What am I referring to? It’ll take shape in a moment (pun intended).
Let me start by giving you a tip around the Visio application itself. Likely, if you have just installed Visio or have never opened it before, upon your initial launch (be it manually launched or Veeam-prompted when this report finishes) your view will look something like this…

This looks simply enough; however, there is a big feature that isn’t enabled by default that Veeam leverages heavily with this report (hint: this is also the reason this report takes a while to compile based on environment size, tons of data to aggregate). Enter the SHAPE DATA window…
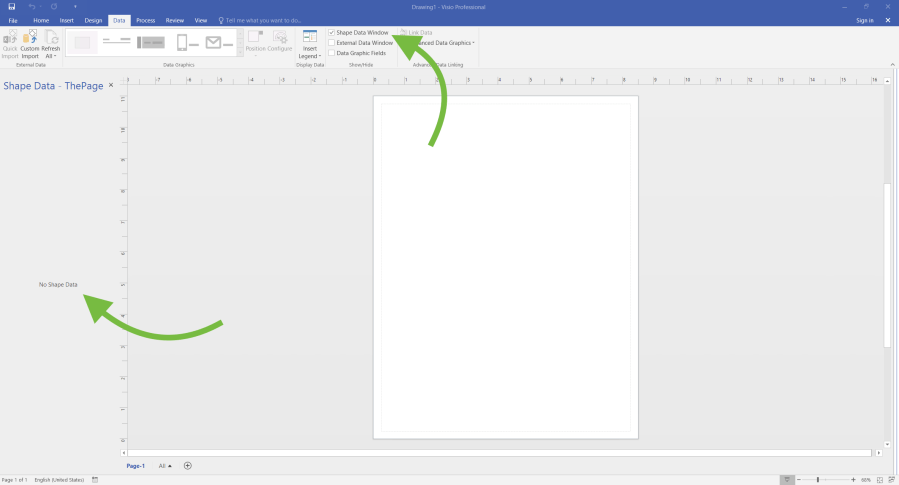
In order to activate this window, personally, I recommend replacing the default Shapes pane with the Shape Data pane and simply dock it on the left-hand side of the screen (as you’ll notice from my screenshots below). Simply navigate over to the Data tab, and you’ll see the checkbox for Shape Data as shown here…

This is where the value of this report really shines.. Once you have this Shape Data pane visible, click on any object in the Visio report. You will then notice the Shape Data pane becomes filled with valuable details & parameters of each object! Check this out…
Finally, as another small tip, every time you run this Visio report, it will generate a subfolder under the session user account’s Documents folder. You’ll see the subfolder will be named with the date when the report was created. Inside, you’ll see the actual Visio reports generated in case you don’t want to leverage the Index (high-level Visio) with the smart tag for navigation and would simply prefer to manually open the one of interest. Also makes it easier for sharing purposes.
Also, since we are on the topic of Visio, don’t forget Veeam provides a FREE Stencil Pack for VMware and/or HyperV! Get ’em via Veeam Stencils
tl;dr
Go to Visio right now, turn on the Shape Data window, dock it on the left, and within 30 seconds you have just quadrupled the value of this particular Veeam ONE report!
Enjoy!
-Matt Price


